FAQ/ Provide a bar chart of rainfall data time series
How do I enter rainfall data?
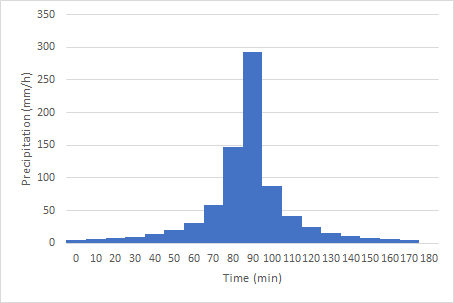
For example, if you want to enter data like the bar chart below, how should you give the rainfall data?
I want the rainfall to change every 10 minutes. I want the same rainfall to last for 10 minutes.
I tried to enter it as follows, but when I look at the line graph display, the rainfall is interpolated. For example, peak rainfall (293 mm/h) has not continued for 10 minutes.
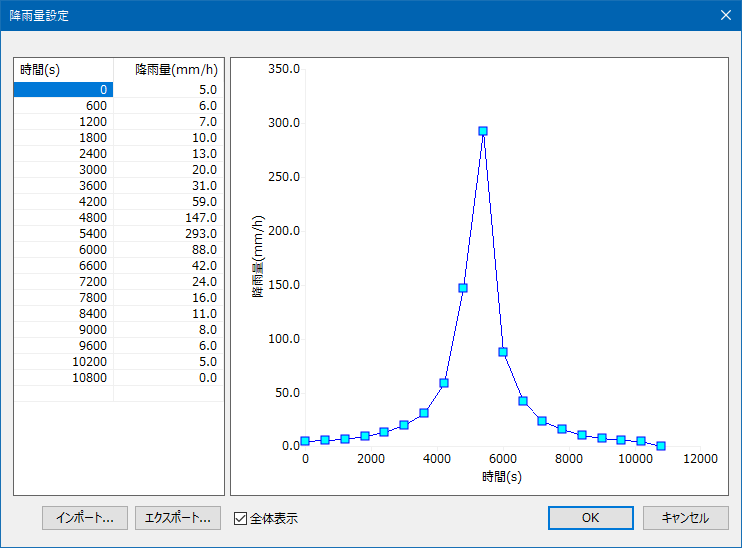
Data
| 時間 (s) | 降雨量 (mm/h) |
|---|---|
| 0 | 5 |
| 600 | 6 |
| 1200 | 7 |
| 1800 | 10 |
| 2400 | 13 |
| 3000 | 20 |
| 3600 | 31 |
| 4200 | 59 |
| 4800 | 147 |
| 5400 | 293 |
| 6000 | 88 |
| 6600 | 42 |
| 7200 | 24 |
| 7800 | 16 |
| 8400 | 11 |
| 9000 | 8 |
| 9600 | 6 |
| 10200 | 5 |
| 10800 | 0 |
response
DioVISTA uses linear interpolation of the time series boundary conditions provided by the user.
- Linearly interpolated boundary conditions include rainfall, upstream flow, and downstream water level.
- Anything before the first record is treated as zero.
- After the last record, the last record is copied.
If you specify the following, the rainfall will change every 10 minutes and the rainfall will be the same for 10 minutes.
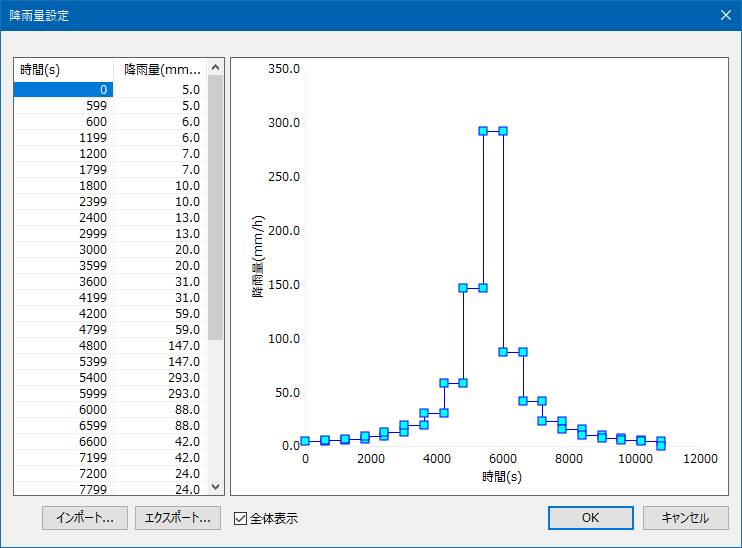
Data
| 時間 (s) | 降雨量 (mm/h) |
|---|---|
| 0 | 5 |
| 599 | 5 |
| 600 | 6 |
| 1199 | 6 |
| 1200 | 7 |
| 1799 | 7 |
| 1800 | 10 |
| 2399 | 10 |
| 2400 | 13 |
| 2999 | 13 |
| 3000 | 20 |
| 3599 | 20 |
| 3600 | 31 |
| 4199 | 31 |
| 4200 | 59 |
| 4799 | 59 |
| 4800 | 147 |
| 5399 | 147 |
| 5400 | 293 |
| 5999 | 293 |
| 6000 | 88 |
| 6599 | 88 |
| 6600 | 42 |
| 7199 | 42 |
| 7200 | 24 |
| 7799 | 24 |
| 7800 | 16 |
| 8399 | 16 |
| 8400 | 11 |
| 8999 | 11 |
| 9000 | 8 |
| 9599 | 8 |
| 9600 | 6 |
| 10199 | 6 |
| 10200 | 5 |
| 10799 | 5 |
| 10800 | 0 |
Related item
- FAQ/ Giving AMeDAS observations as rainfall data time series
- Technical Reference/ Boundary Conditions/ Rainfall
- Technical Reference/ Boundary Conditions/ Rainfall Scenarios
Last update:
2023-03-20