Project/ Gutter / Gutter/ Data
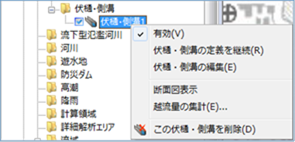 Figure: Gutter and gutter data
Table: Context menu items and functions for gutters
| Context menu items | function |
|---|---|
| valid | Set the enable/disable of downsputter and gutter data. |
| Continue to define gutters and gutters | Continue to create definitions for gutter and gutter data. |
| Editing gutters and gutters | Edit the gutter and gutter data. |
| Cross-sectional view display | Displays a cross-sectional view of the gutter and gutter data. |
| Aggregation of overflow flow | Overflow flow rate is aggregated from gutter and gutter data. |
| Delete this gutter | Delete the gutter data. |
valid
Enable/Disable. If enabled, a check is displayed.
Continue to define gutters and gutters
It is created from the continuation of the final point of the created gutter / gutter line segment.
For the operation method, refer to Project / Fushi / Gutter / Creating a new gutter / Gutter.
Editing gutters and gutters
-
When you select a menu, vertices are displayed.
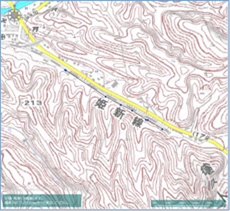
Figure: Editing gutters and gutters.Table: Editing and operation of gutters
Editing operation migration Select a vertex and move it with mouse drag. addition Click on the line to add a vertex. deletion [Ctrl] Hold down the key and click a vertex to delete the vertex. -
To revert to the previous state, [Revert] select Edit menu .
-
To cancel editing,[Esc] press the key.
-
[Enter] Press the key to confirm your edits.
Cross-sectional view display
When you select the menu, a cross-sectional view appears below the map.
You can check the elevation of the cross-section and longitudinality, and check the simulated water level and flow rate.
In addition, cross-sectional and longitudinal information of simulation results can be exported.
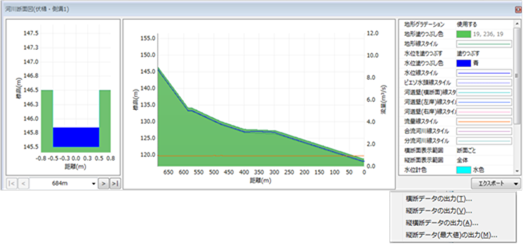 Figure: Cross-sectional view
Table: Export Simulation for Section View Menu and Output
| Export Menu | Output content |
|---|---|
| Output section data | The displayed cross-sectional information "time (s)", "water level (m)", "water depth (m)", "flow rate (m^3/s)", "flow velocity (m/s)", and "overflow state" are output. |
| Output profile data | Distance marker (m), water level (m), water depth (m), flow rate (m^3/s), flow velocity (m/s), and overflow state are output at the displayed time. |
| Output of cross-sectional data | Cross-sectional information at all times, "distance marker (m)", "water level (m)", "water depth (m)", "flow rate (m^3/s)", "flow velocity (m/s)", and "overflow state" are output. |
| Output of profile data (maximum value) | Maximum value information for each cross-section, "Maximum water level (m)", "Maximum water level generation time (S)", "Maximum flow rate (m^3/s)", and "Maximum flow generation time (s)" are output. |
Aggregation of overflow flow
When you select a menu, a [Aggregation of overflow flow] dialog appears. When you specify each item [OK] and click the button, the summary result is output.
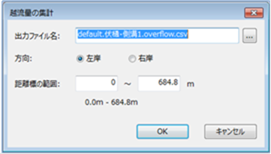 Figure: Overflow summary dialog
Table: Item names and output contents of the Aggregate Flow Overflow dialog
| Item Name | Output content |
|---|---|
| Output File Name | Set the output destination. The initial output destination is the project folder. In addition, the file name is "default.《Name of gutter》.overflow.csv". |
| direction | Set the direction to be aggregated, "Left Bank" or "Right Bank". The default value is "Left Bank". |
| Distance marker range | Set the range of distance markers to be aggregated. The default value is the entire interval. |
Delete this gutter
When you select the menu, a confirmation message appears. [Yes] Click the button to delete this gutter data.
 Figure: Removing gutters and gutters.