Project/ Flowing flood river
Main applications
- When the flood tendency is downstream, the inundation depth is calculated by one-dimensional analysis.
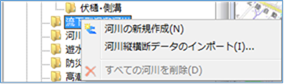 Figure: Downward flooding river
Table: Context menu items and functions of flowing flood rivers
| Context menu items | function |
|---|---|
| Create a new river | Create a new river. |
| Import river cross-section data | Import rivers from river cross-section data. |
| Delete all rivers | Delete all rivers. |
Create a new river
-
When you select the menu, new flowing flood river data is created under the Flowing Flood Rivers' folder.
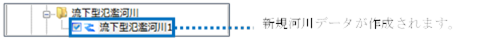
Figure: Creating a new river -
Set the settings related to the data of the flowing flood river on the property screen.
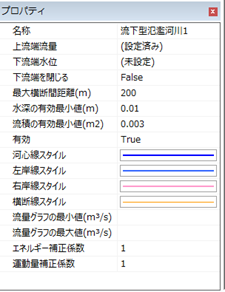
Figure: Properties screen of flowing flood river data settingTable: Property name settings for downstream flood rivers data settings
Property Name What to set name Enter a name of your choice. Upstream flow rate On the hourly upstream flow setting screen, set the upstream flow rate for the time (s) change.
The initial value is set to flow down 100m^3/s constant flow rate.Downstream water level Set the downstream water level for time(s) changes on the hourly downstream water level setting screen.
The initial value is not set.Close downstream end Sets the downstream state.
The initial value is False.
True: The downstream end is closed.
False: The downstream end is not closed.Maximum cross-section distance (m) Specify the maximum cross-section distance. The standard is about the same as the width of the river.
The default value is "200".Minimum effective water depth (m) Set the water limit depth.
The default value is "0.01". You can specify 0.0001~0.1.Minimum effective value of current product (m^2) Set the critical flow product.
The default value is "0.003". You can specify 0.0003~0.03.valid Enable/disable settings.
The initial value is True.
True: Enabled:
False: DisabledKawashin Line Style Specify the river line style (line type/line width/line color) to be displayed on the map.
The initial values are as follows:
Line Type: Solid Line Width: 2px
Line Color: RGB (0, 0,255)Left Bank Line Style Specify the left bank line style (line type/line width/line color) to display on the map.
The initial values are as follows:
Linetype:
Solid Lineweight: 2px Linecolor:
RGB(51,102,255)Right bank line style Specify the right bank line style (line type/line width/line color) to display on the map.
The initial values are as follows:
Linetype:
Solid Line Width: 2px
Line Color: RGB (255,153,204)Section line style Specify the section line style (line type/line width/line color) to display on the map.
The initial values are as follows:
Linetype:
Solid Line Width: 2px Linecolor:
RGB(255,153, 0)Minimum value of flow graph (m^3/s) Set the minimum value of the vertical axis of the flow rate graph in the profile view of the river cross-sectional view screen.
The initial value is not set.Maximum value of flow graph (m^3/s) Set the maximum value of the vertical axis of the flow rate graph in the profile view of the river cross-sectional view screen.
The initial value is not set.Energy correction factor Sets the energy correction factor.
The default value is "1". You can specify 0.1~3.Momentum correction factor Sets the momentum correction factor.
The default value is "1". You can specify 0.1~3.
Import river cross-section data
-
Check the loading behavior during import.
In the environment setting "Operation when loading periodic cross-sectional data", the initial value is "Automatic estimation". Automatic estimation may not be set according to the node name flag, so if you want to specify the right bank shoulder / left bank shoulder according to the node name flag, change it to "Follow node name flag". -
When you select the menu, the folder selection dialog appears.
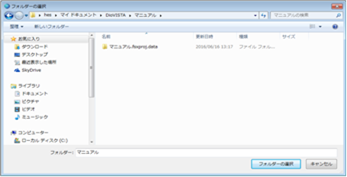
Figure: Select Folder Dialog -
The formats that can be imported are section data (OUDAN.csv) and distance marker data (KUI.csv) specified in the Guidelines for Creating Regular River Crossing Data.
Specify the folder where these two files are stored and[Select Folder] click the button.
For more information on file formats, please refer to Technical Reference River Models/Importing Cross-Section Data.
Delete all rivers
When you select the menu, a confirmation message appears. [Yes] Click the button to delete all downstream flood river data.