FAQ/ Porosity and Transmittance Data Sources
What is the data source for porosity and transmittance that DioVISTA provides by default?
Are you creating a house / building polygon from DM data and calculating the occupancy rate of the house / building polygon for the lattice polygon?
response
Set the porosity and transmittance for each land use category.
In the dialog that appears in[tool] the DioVISTA menu [Preferences] >, select > [Flood simulation] and the [land use] following screen will appear.
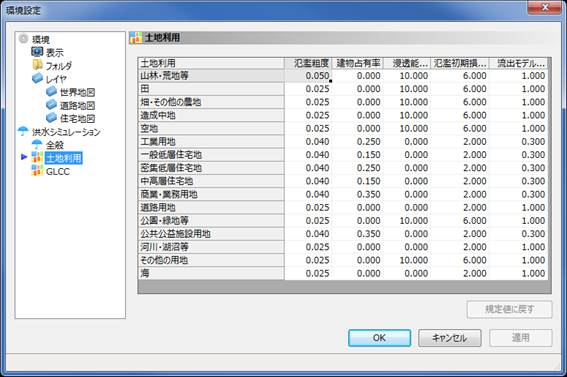 Figure: Land Use and Roughness Conversion Table
For each land use, you can set a building occupancy ratio. Porosity and transmittance are 1 minus the building occupancy. That is, it is obtained by the following equation.
Porosity = 1 - Building occupancy
Equivalence = 1 - Building occupancy
If the porosity value is less than the lower limit value of 0.1, all cells are considered invalid cells occupied by the building. For details, please refer to Technical Reference/Flood Model/Porosity.
Porosity and transmittance are valid only if you select as the basis formula for the flood model [Manual 4th Edition Compliant] . If you select any other basic formula (for example [Linear] , ), it is invalid (porosity and transmittance are not used). For details of the basic formula, please refer to Technical Reference/Flood Model/Basic Formula.
The porosity and transmittance provided by DioVISTA by default are not values set by automatically deciphering the outer frame of each building. For example, if you want to find the occupancy of a house or building polygon for a lattice polygon, the current method seems to be the easiest way to create it in another GIS and then import it into DioVISTA. Reference: How to create building occupancy mesh data using QGIS - Qiita
Rationale for the default building occupancy
The default value of the building occupancy rate is the flood simulation manual (draft) (February 8) p. 70, Figure 30 The decision was made with reference to "Distribution of building occupancy by land use by use". The values in this document are based on surveys conducted at 160 locations in 29 cities nationwide. Using an urban planning map at a scale of 1:2,500, the area of the building was calculated for a square with a side of 500 m per place and divided by the total area. The breakdown of the 29 cities is as follows.
- ~ 500,000 people: 11 cities
- ~1 million people: 11 cities
- 1 million people~: 7 cities
As a result, the value of theta of building occupancy is written as follows.
| land use | Building occupancy |
|---|---|
| Central Business District (35 locations) | 0.3~0.4 |
| Industrial districts (34 locations) | 0.2~0.3 |
| Residential area (45 locations) | 0.1~0.2 |
| Other urban areas (46 locations) | 0.3~0.4 |
With reference to this value, we have assigned it as follows.
| land use | Building occupancy |
|---|---|
| Forests, wastelands, etc. | 0 |
| field | 0 |
| Farmland and other farmland | 0 |
| Land under development | 0 |
| Open space | 0 |
| Industrial site | 0.25 |
| General low-rise residential area | 0.15 |
| Densely populated low-rise residential area | 0.25 |
| Medium- and high-rise residential areas | 0.15 |
| Commercial and commercial land | 0.35 |
| Road land | 0 |
| Parks, green spaces, etc. | 0 |
| Other Utility Sites | 0.35 |
| Rivers, lakes, etc. | 0 |
| other | 0 |
| sea | 0 |
| Outside the target area | 0 |
Related item
- FAQ/ Roughness Factor Data Source
- Technical Reference/ Flood Model/ Porosity
- Technical Reference/ Map Data/ Terrain Editing