FAQ/ I want to output the inundation depth time series of an arbitrary point
After running the flood simulation, I would like to output the inundation depth time series of any point.
Is there a better way?
response
I think it is better to output the time series data with netCDF, specify the latitude and longitude of the desired point from the netCDF file, and output the time series. For details on how to output time series data in netCDF, refer to Technical References/ I/O functions/ Export calculation results / CSV, NetCDF.
To analyze netCDF files through the screen, GIS tools such as QGIS come in handy. The following video shows how to view a netCDF file on a map, click the map to see a graph of the change over time for that location, and view the values shown in the graph in a tabular format.
Visualize pixel timeseries from netCDF in QGIS 2.18
To analyze netCDF files through the command line, analysis tools such as Python are useful. Here is a sample source for output in Python 3.6 or later.
The netcdf4 module is required for analysis. If you are using conda, run the following command:
1 2 | |
1 2 3 4 5 6 7 8 9 10 11 12 13 14 15 16 17 18 19 20 21 22 23 24 25 26 27 28 | |
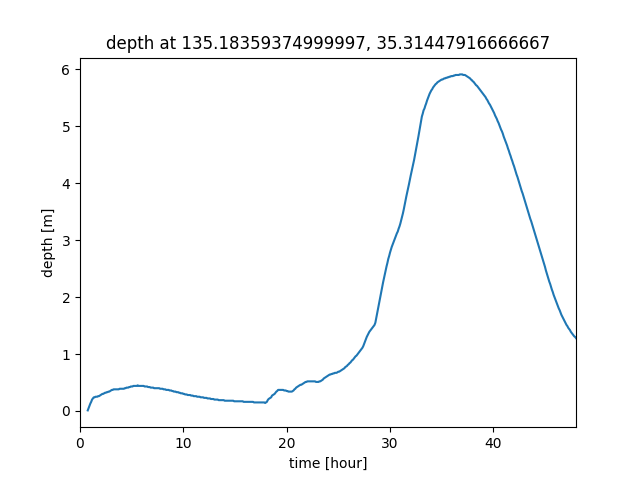
When this is executed, the water depth time series data of one point (the cell closest to longitude 135.183667, latitude 35.314539) is output from the C:\temp\BP001.nc file as a graph and CSV file. The output file names are C:\temp\BP001.nc.csv and C:\temp\BP001.nc.png. These are specified in lines 27 to 28, so please rewrite them as necessary. Here is an example of the output graph: