Menu bar/ Display
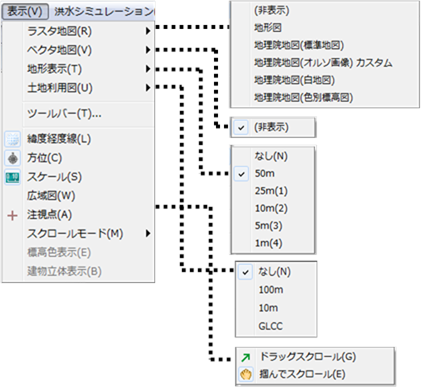 Figure: View menu
Table: View menu items and functions
| item | function |
|---|---|
| Raster Map | Sets the type of raster map to display. |
| Vector Map | Sets the type of vector map to display. |
| Terrain display | Sets the mesh size of the terrain to be displayed. |
| Land Use Map | Sets the mesh size of the land use map displayed in the main window. |
| toolbar | Select the toolbar you want to display. |
| Latitude and longitude lines | Displays latitude-longitude lines in the main window. |
| bearing | Displays the compass in the main window. |
| scale | Displays the scale in the main window. |
| Wide-area map | Displays a wide-area map in the main window. |
| Point of interest | Displays the point of interest in the main window. |
| Scroll mode | Select a scroll mode for the map. |
| Elevation color display | Color the map by elevation. |
| Three-dimensional display of buildings | Displays the building stereoscopically. (A separate housing map is required) |
Raster Map
Select the raster map you want to display from the menu.
The map display in the main window will be toggled.
If you select nothing, NASA satellite images are displayed.
The raster maps that are defaulted to DioVISTA are topographic maps and GSI maps.
Table: Raster map items and overview
| item | summary |
|---|---|
| (Hide) | Do not display raster maps. |
| Topographic map | Geospatial Information Authority of Japan Display Numerical Map 25000 |
| GI Map (Standard) | Displays the standard map of the Geospatial Information Authority of Japan (GSI) map. |
| Map of the Institute of Geography (ortho image) | Displays the standard map and orthoimage of the Geospatial Information Authority of Japan Geospatial Information Authority map. |
| Map of the Institute of Geography (White Map) | Display a white map of Geospatial Information Authority of Japan Geospatial Information Authority map. |
| GI Map (Elevation Map by Color) | Displays the geographical survey authority map of the geographical institute map by color. |
Vector Map
Select the vector map you want to display from the menu.
The map display in the main window will be toggled.
There is no default vector map in DioVISTA.
Optional map data (house map, road map) is displayed in vector data.
Table: Vector map items and overview
| item | summary |
|---|---|
| (Hide) | Do not display vector maps. |
| *Residential Map | View the housing map. |
| *road map | View the road map. |
*: Displayed only if optional data has been purchased. It is not displayed by default.
Terrain display
Select the mesh size of the terrain display from the menu.
Toggles the elevation mesh size of the terrain display in the main window.
The default value is a mesh size of 50 m.
If you select a mesh size that does not exist, it is displayed with the most recent mesh size that is larger than that mesh size.
For example, if you select a 5m mesh while up to 50m mesh exists, it will be displayed with a 50m mesh.
Table: Mesh size and overview of terrain display
| Mesh Size | summary |
|---|---|
| without | Display as a flat surface. |
| 50m | Three-dimensional display with a mesh size of 50m. |
| *25m | Three-dimensional display with a mesh size of 25m. |
| *10m | Three-dimensional display with a mesh size of 10m. |
| *5m | Three-dimensional display with a mesh size of 5m. |
| *1m | Three-dimensional display with a mesh size of 1m. |
*: Displayed only if optional data has been purchased. It is not displayed by default.
Land Use Map
Select the mesh size of the land-use map to display from the menu.
The main window displays a land-use map with the specified mesh size.
The default value is a mesh size of 100 m.
Table: Mesh size and overview of land use maps
| Mesh Size | summary |
|---|---|
| without | Do not display land use maps. |
| 100m | Displays a land use map with a mesh size of 100 m. |
| 10m | Display a land use map with a mesh size of 10 m. |
| GLCC | Displays a land use map of GLCC data. |
toolbar
When you select a menu, a dialog like the one shown below [toolbar] is displayed. Check the subwindows you want to display [OK] and click the button.
The checked subwindow will appear.
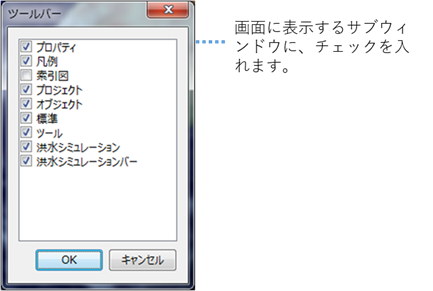 Figure: Toolbar dialog
Table: Toolbar items and descriptions
| item | summary |
|---|---|
| property | Displays the Properties window. 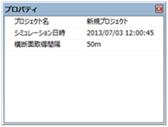 |
| legend | Displays the Legend panel. 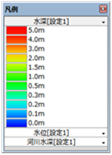 |
| Index diagram | Displays an index map of the map. 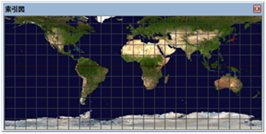 A + appears at the current map display location. Also, click a square on the screen to move the map to that location. Right-click on the index map to select a projection of the map. |
| project | Display the Project window. 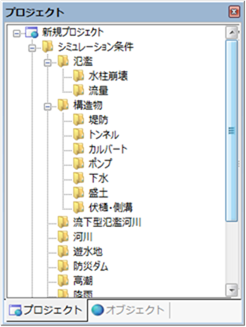 |
| object | Displays the Object window. If both the Project window and the Object window are displayed, the tab view is displayed. 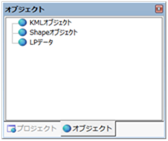 |
| standard | Displays the toolbar for standard functions. 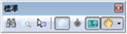 |
| tool | Displays the toolbar of tool functions.  |
| Flood simulation | Displays the toolbar for the flood simulation feature. 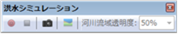 |
| Flood Simulation Bar | Displays the flood simulation bar.  |
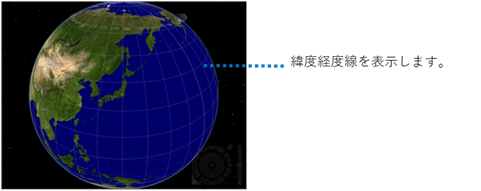
Latitude and longitude lines
When you select the menu, the latitude-longitude line is displayed. If you want to hide it, select the menu again.
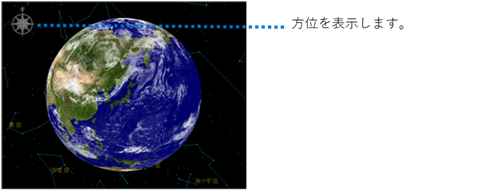
bearing
When you select the menu, the compass is displayed. If you want to hide it, select the menu again.
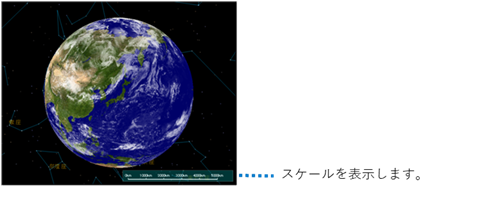
scale
When you select the menu, the scale is displayed. If you want to hide it, select the menu again.
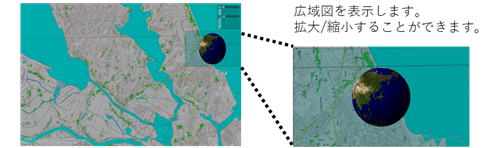
Wide-area map
When you select the menu, a wide-area map is displayed. If you want to hide it, select the menu again.
- Wide-area map
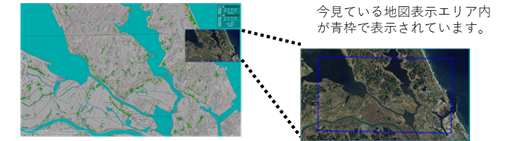
- Wide area map (within the map display area)
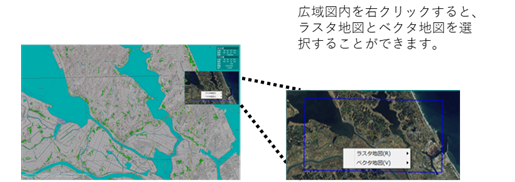
- Wide-area map (map selection)
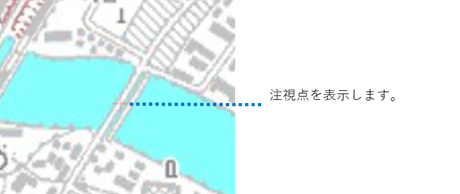
Point of interest
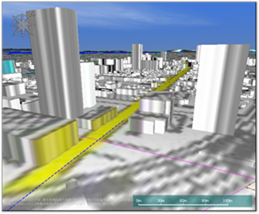
When you select a menu, the point of interest is displayed. A (+) appears in the center of the image to indicate the center of the screen. If you want to hide it, select the menu again.
Scroll mode
Select a scroll mode from the menu.

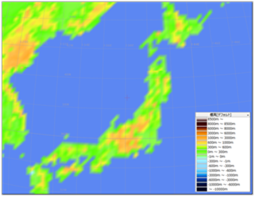
Elevation color display
Select the menu to display the raster map when it is hidden. It is color-coded by elevation. If you want to hide it, select the menu again.
Three-dimensional display of buildings
-
Displays a vector map of houses.
-
When you select the menu, the building is displayed in three dimensions. If you want to hide it, select the menu again.