FAQ/ LP Data Visualization
Can I display point clouds of LP data (laser profiler, lidar data) on a map?
response
You can view it. Here is an example of what you might see:
The supported format is CSV format.
It also supports CSV formats, *_grd.txt format and *_org.txt format (Manual for Preparing Digital Elevation Model (DEM) by Aerial Laser Survey (draft) (revised in April 18), p. 40).
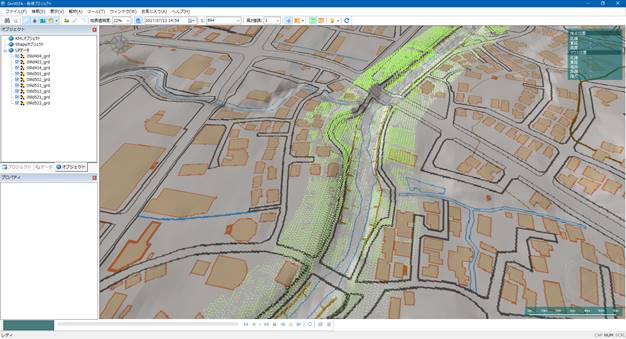
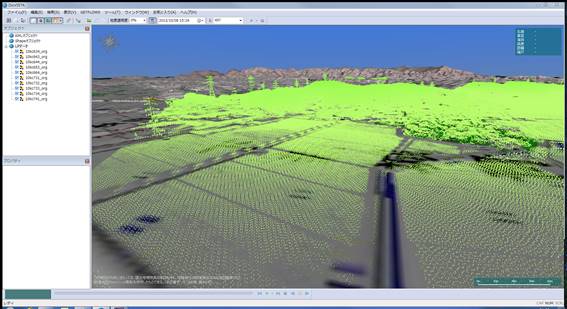 Figure: Visualization of LP data with DioVISTA
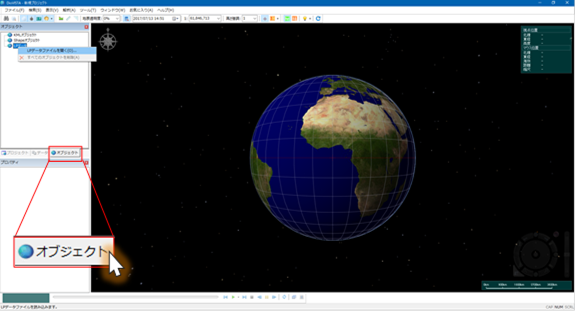
Here are the steps on how to import it.
From the left pane of the screen, click the Objects tab.
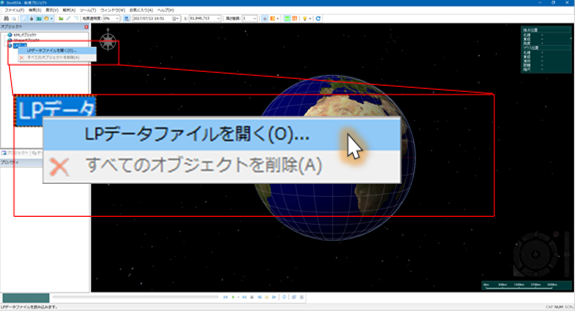
Right-click LP Data in the Objects pane and choose Open LP Data File.
Select the files you want to target. This example shows how to open a CSV file (*_grd.txt format).
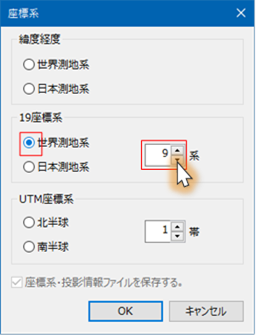
The Import LP Data dialog box appears. Set the coordinate system and the fields to be captured.
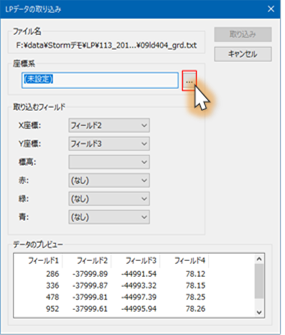
Here, 19 coordinate systems (Japan plane rectangular coordinate system) and 9 world geodetic systems were selected as coordinate systems.
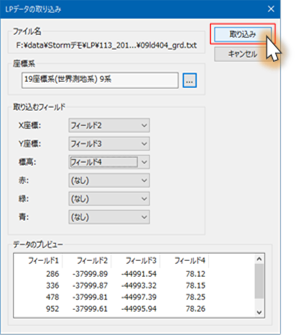
I also specified field 4 (column 4 in the CSV file) as the elevation.
Press the "Import" button.
LP data was displayed on the map screen.