Menu Bar/Tools
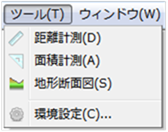 Figure: Tools menu
Table: Tools menu items and functions
| item | function |
|---|---|
| Distance measurement | Displays a specified range of distances. |
| Area measurement | Displays the area of the specified range. |
| Topographic cross-section | Displays the topographic section for a specified extent. |
| Preferences | Configure DioVISTA. |
Distance measurement
-
Select a menu and click the mouse on the map to specify the line to measure.
Specify with a line.
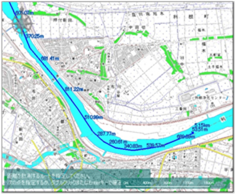
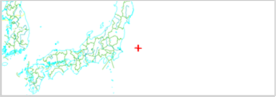
Figure: Distance measurement (specifying the line to measure) -
To revert to the previous state, right-click or [BackSpace] press the key.
-
To cancel the creation, [Esc] press the key.
-
Double-click or [Enter] press the key to accept the range.
At the top right of the main window, you will see the distance of the specified range.
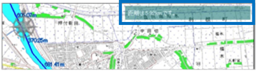
Figure: Distance measurement (ranged)
Area measurement
-
Select the menu and click the mouse on the map to specify the area to measure.
Specify the range with a line. [Ctrl] If you hold down the key and select the start and end points, you can specify the extent with a rectangle.
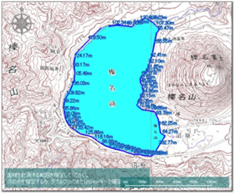
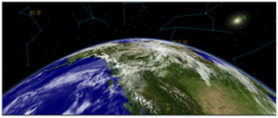
Figure: Area measurement (range specification) -
To revert to the previous state, right-click or [BackSpace] press the key.
-
To cancel the creation, [Esc] press the key.
-
Double-click or [Enter] press the key to accept the range.
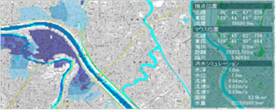
In the upper right corner of the main window, the area of the specified range is displayed.
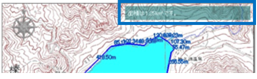
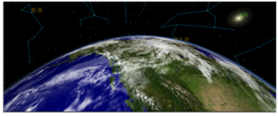
Figure: Area measurement (displaying area)
Topographic profile
-
Select the menu and click the mouse on the map to specify the area to measure.
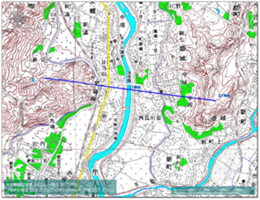
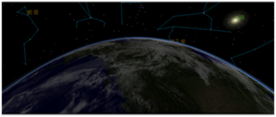
Figure: Topographic cross-section (section designation) -
To revert to the previous state, right-click or [BackSpace] press the key.
-
To cancel the creation, [Esc] press the key.
-
Double-click or [Enter] press the key to accept the range.
A topographic profile of the specified range is displayed on the Output screen.
The start point of the specified range is displayed in a left-hand orientation and the end point is displayed in right-hand orientation.
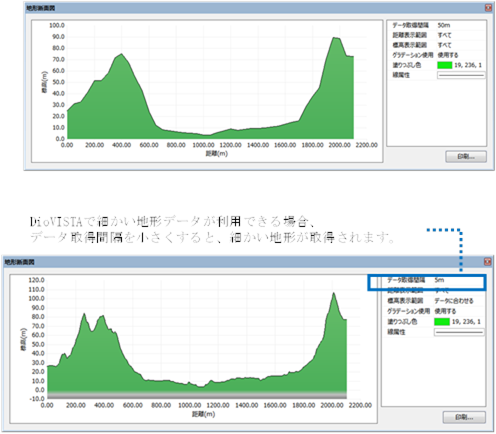
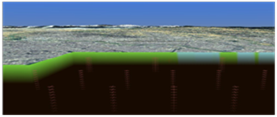
Figure: Display a topographic profile of a specified area
preferences
When you select a menu, [Preferences] a dialog appears. Configure DioVISTA.
-
indication
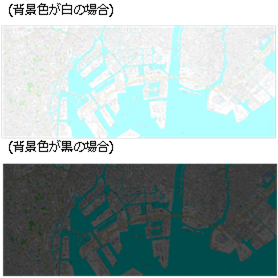
Configure the display settings of the main window of DioVISTA.
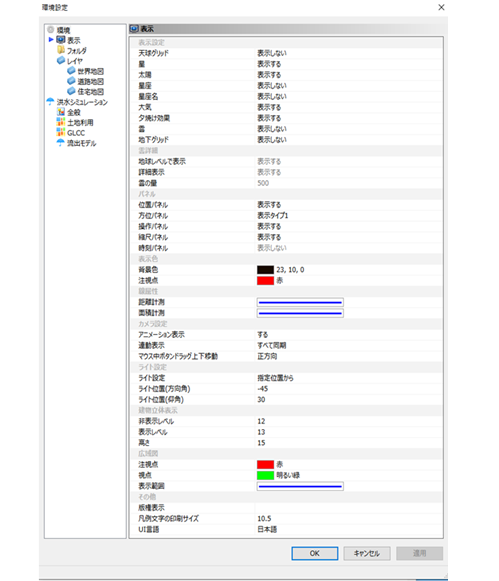
Figure: DioVISTA Configuration -
folder
Set the location of each data folder in DioVISTA.
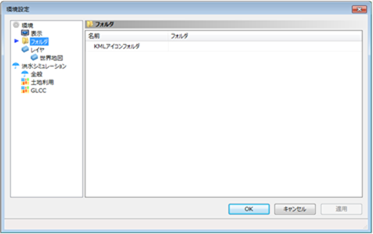
Figure: Setting the location of each data folder in DioVISTATable: DioVISTA data folder descriptions
folder explanation KML Icon Folder Set the icon data folder to be displayed by the KML function. -
layer
Change the layer settings for vector maps (world maps, house maps, and road maps).
You can show or hide each layer displayed on the map, set line attributes, display scale levels, and so on.
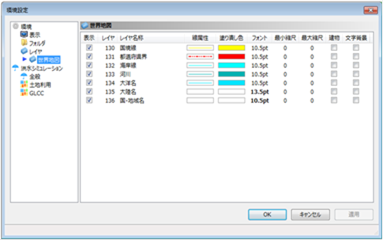
Figure: Changing layer settings for a vector mapTable: Setting and description of layer settings for vector maps
Setting items explanation indication If you want to display it, check it. layer Displays the number of the layer. Layer Name Set the name of the layer. Line Attributes For line data, set the line attributes. 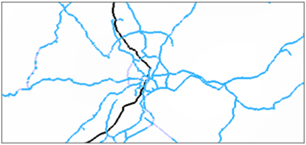
Fill color For surface data, sets the fill color. 
font For font data, set the font size. 
Minimum scale Sets the minimum scale at which to display data. If it is smaller than the scale you set, it will not appear. Maximum scale Sets the maximum scale at which to display data. If it is larger than the scale you set, it will not appear. building Check to display buildings. Text background If checked, the background is the color you set to the fill color. 
-
Flood Simulation/General
Configure the general settings for the flood simulation.
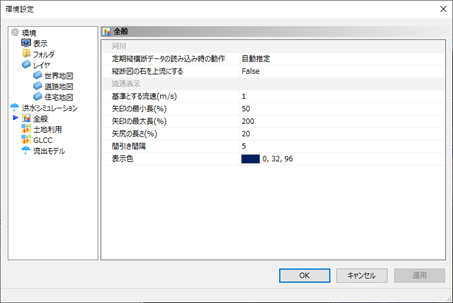
Figure: General flood simulation settings表: 洪水シミュレーションの全般の設定項目と説明
設定項目 説明 河川 定期縦横断データの読み込み時の動作 河川の定期縦横断データのインポート時の動作を設定します。
初期値は、「自動推定」です。
「自動推定」: 節点名フラグを考慮した自動推定します。
「節点名フラグに従う」: 節点名フラグを優先した設定になります。
詳細は テクニカルリファレンス/ 河川モデル/ 縦横断データのインポートをご参照ください。縦断図の右を上流にする 河川断面図画面の縦断図を表示する方法を設定します。
初期値は、「False」です。
「False」: 縦断図の左側を上流にして表示します。
「True」: 縦断図の右側を上流にして表示します。流速表示 基準とする流速(m/s) 地図上に表示する流速ベクトル(矢印)の基準とする流速を指定します。 矢印の最小長(%) 地図上に表示する流速ベクトル(矢印)の最小長を%で指定します。 矢印の最大長(%) 地図上に表示する流速ベクトル(矢印)の最大長を%で指定します。 矢尻の長さ(%) 地図上に表示する流速ベクトル(矢印)の矢尻の長さを%で指定します。 間引き間隔 地図上に表示する流速ベクトル(矢印)の間引き間隔を指定します。 表示色 地図上に表示する流速ベクトル(矢印)の色を指定します。 矢印の描画方法について
- 矢印を大きくしたい場合は、 [基準とする流速(m/s)] を小さい値にしてください。
- 矢印が込み合っている場合は、[間引き間隔] を大きい値にしてください。
- なお、矢印は次の方法で描画されます。
- 流速が0ならば矢印は描画されない。
- 流速が0でないならば、 流速 / [基準とする流速] * ([基準とする流速] の矢印の長さ) の矢印が描画される。
- ただし、(矢印の最小長) が最小、 (矢印の最大長) が最大となるように調整されます(clamp演算)。
- 間引き間隔1の場合、すべての矢印が表示されます。間引き間隔Nの場合、X方向およびY方向にN個おきに矢印が表示されます。
- ([基準とする流速] の矢印の長さ) = (セルの長さ) * [間引き間隔] * 1/2
- (セルの長さ) = sqrt((X方向のセルの長さ)^2 + (Y方向のセルの長さ)^2)
- (矢尻の長さ) = ([基準とする流速] の矢印の長さ) * [矢尻の長さ(%)] (個々の流速に関わらず一定の大きさ)
- (矢印の最小長) = ([基準とする流速] の矢印の長さ) * [矢印の最小長(%)]
- (矢印の最大長) = ([基準とする流速] の矢印の長さ) * [矢印の最大長(%)]
-
Flood simulation/land use {: #_Ref_5_6_005}
Configure settings related to land-use data.
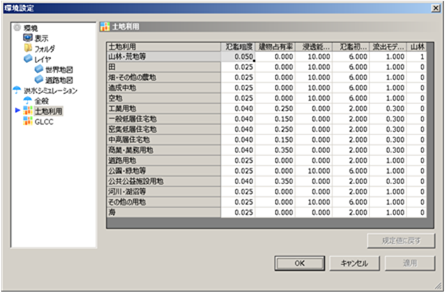
Setting items explanation land use Sets the roughness of the land-use data.
[Restore default values] Click the button to restore the default value.Flood roughness Sets the roughness to use for the flood model. Building occupancy Set the building occupancy. Penetrating capacity Sets the ability of rainfall to seep through each land use.
Valid only when the option "Provide infiltration capacity according to land use" is checked at the start of the simulation.Initial flood loss Sets the ability of rainfall to permeate each land use.
Valid only if the option "Provide infiltration capacity according to land use" is checked at the start of the simulationSpill model roughness Sets the roughness to use in the spill model. mountain forest When calculating the three-tier parameter, set the land use classification to seep through.
"1": penetrating
"0": Not penetrating -
Sets the roughness of the GLCC data.
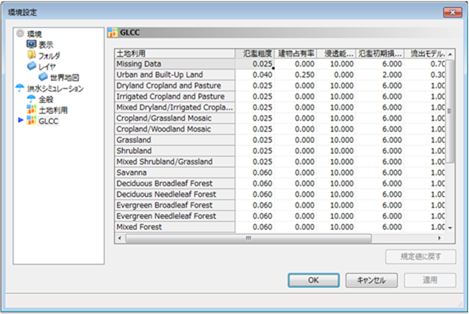
Setting items explanation GLCC Sets the roughness of the GLCC data.
[Restore default values] Click the button to restore the default value. -
Spillage model
Set up a three-layer model of the outflow model.
If you have set the three-layer model parameter for individual rivers, it does not apply.
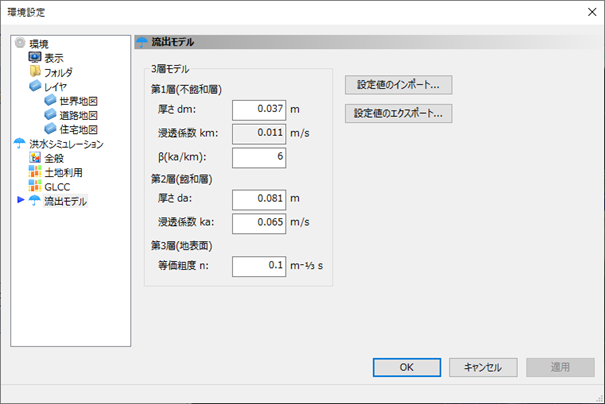
Figure: Setting up a three-tier model of an outflow model表: 流出モデルの3層モデルの設定項目と説明
設定項目 説明 3層モデル 3層モデルの各パラメータを設定します。3層モデルのパラメータを、河川単位に指定した場合(プロジェクト/ 河川を参照)、河川単位に指定した値が優先して使われます。
3層モデルとは、(参考文献20)に記載されたモデルのことを指します。第1層(不飽和層) 厚さ dm 第1層の層厚を設定します。 浸透係数 km Ka÷βの値が自動で設定されます。 β(ka/km) 第2層の飽和透水係数と第1層の飽和透水係数の比を設定します。 第2層(飽和層) 厚さ da 第1層+第2層に相当する層厚を設定します。 浸透係数 ka 第2層での飽和透水係数を設定します。 第3層(地表面) 等価粗度 n 等価粗度を設定します。