FAQ/ What is the difference from DioVISTA Storm
Hitachi Power Solutions software DioVISTA Flood and DioVISTA Storm are very similar. What's the difference?
response
In order to provide information technology that responds to the increased risk of heavy rain and flood due to climate change, Hitachi Power Solutions develops and sells DioVISTA Flood and DioVISTA Storm.
Both of these products are products that plug in functions to DioVISTA, which is a global 3D GIS.
DioVISTA Flood provides flood simulation capabilities.
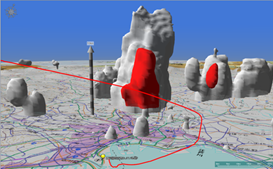
DioVISTA Storm provides visualization capabilities for simulation data. The software is suitable for visualizing NetCDF files on 3D maps.
| product | DioVISTA Flood | DioVISTA Storm |
|---|---|---|
| purpose | Flood analysis and prediction | Visualization of analysis and observation data |
| Launch | Jun. 2006 | Aug 2014 |
| image | 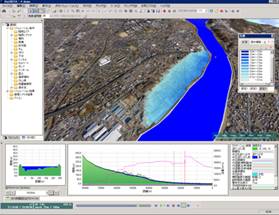 |
 |
DioVISTA Storm visualization sample
Flood Expected Area Map
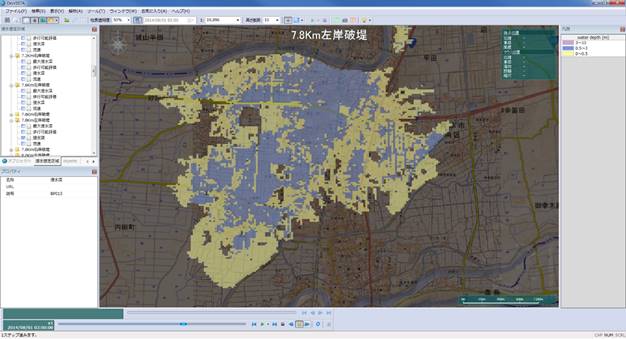
Data used
Flood simulation data: Ministry of Land, Infrastructure, Transport and Tourism (Gov. of Japan)
Map & terrain data: Geospatial Information Authority of Japan
In preparing this map, with the approval of the Director of the Geospatial Information Authority of Japan, basic map information and electronic topographic maps (tiles) issued by the Geospatial Information Authority of Japan were used. (Approval No. 29, No. 641)
Tsunami simulation
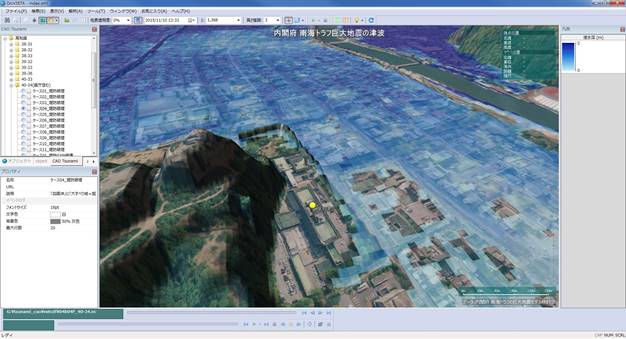
Data used
Tsunami simulation data: Disaster Management, Cabinet Office (Gov. of Japan) / Cabinet Office Nankai Trough Giant Earthquake Model Study Group
Map & terrain data: Geospatial Information Authority of Japan
In preparing this map, with the approval of the Director of the Geospatial Information Authority of Japan, basic map information and electronic topographic maps (tiles) issued by the Geospatial Information Authority of Japan were used. (Approval No. 29, No. 641)
Atmospheric Diffusion Simulation
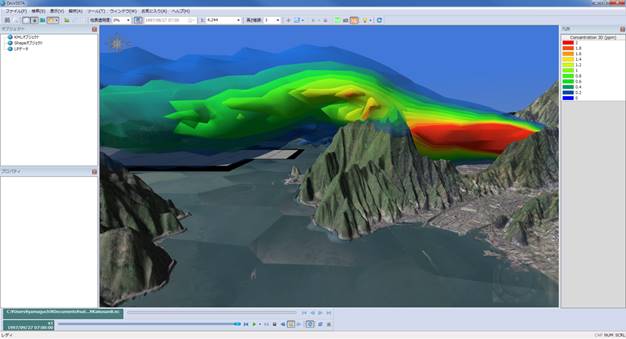
Map: Geospatial Information Authority of Japan In preparing this map, with the approval of the Director of the Geospatial Information Authority of Japan, basic map information and electronic topographic maps (tiles) issued by the Geospatial Information Authority of Japan were used. (Approval No. 29, No. 641)
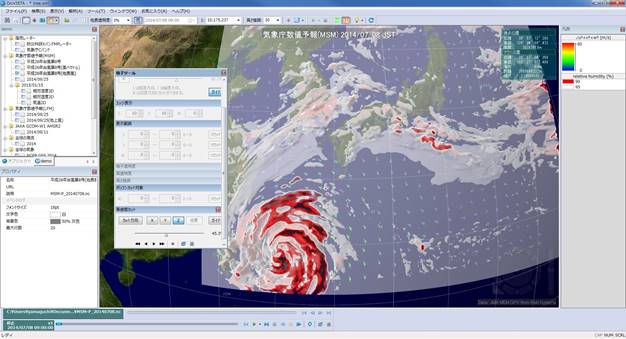
Mesonumerical Forecast Model GPV (MSM)
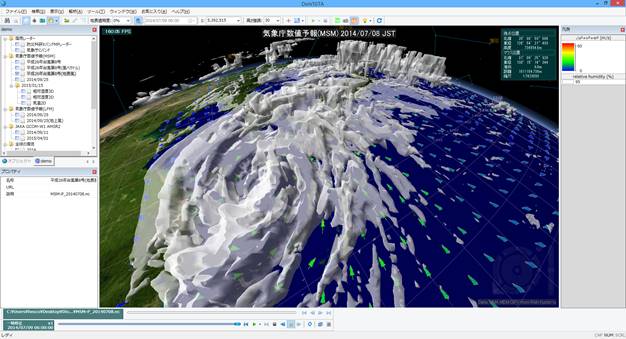
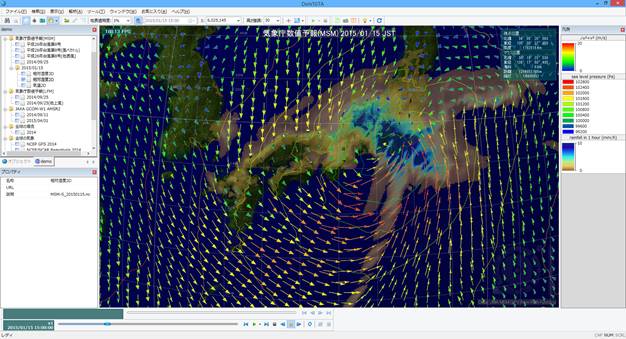
Data used
Numerical weather forecast (meso scale model): Japan meteorological Agency
Blue Marble: Next Generation courtesy of NASA Earth Observatory. Landsat image courtesy of the Global Land Cover Facility (GLCF).
Using high-resolution digital topography data from NASA's Shuttle Radar Topography Mission (SRTM).
Local Numerical Forecast Model GPV (LFM)
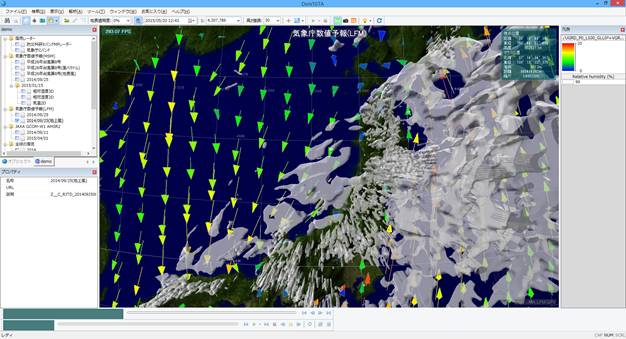
Data used
Numerical weather forecast (local forecast model): Japan meteorological Agency
Blue Marble: Next Generation courtesy of NASA Earth Observatory. Landsat image courtesy of the Global Land Cover Facility (GLCF).
Using high-resolution digital topography data from NASA's Shuttle Radar Topography Mission (SRTM).
NOAA Global Forecast System
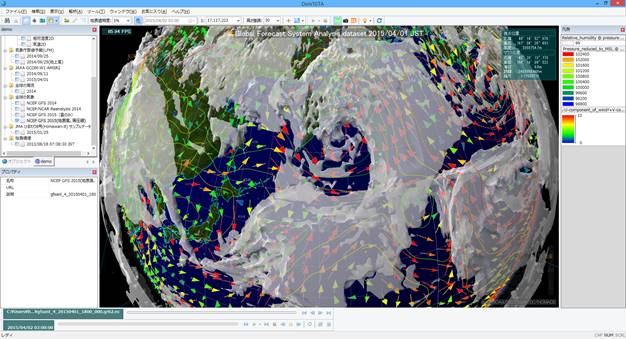
Data used
NCEP High Resolution Global Forecast System Analysis dataset (GFS-ANL 004 (0.5 degree)) provided by the NOAA/NESDIS/NCDC/NOMADS from their Web site at http://nomads.ncdc.noaa.gov/data.php#hires_weather_datasets
Blue Marble: Next Generation courtesy of NASA Earth Observatory. Landsat image courtesy of the Global Land Cover Facility (GLCF).
Using high-resolution digital topography data from NASA's Shuttle Radar Topography Mission (SRTM).
WRF
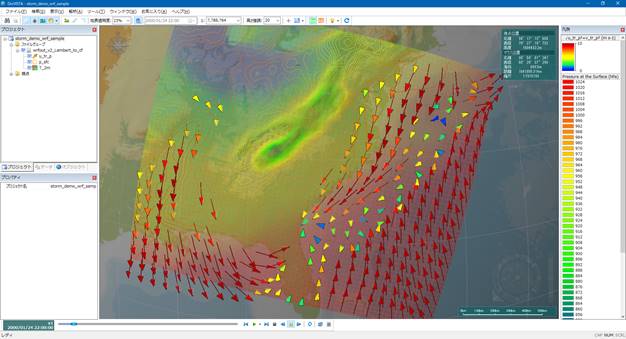
Data used
WRF sample data: UCAR Example netCDF files, https://www.unidata.ucar.edu/software/netcdf/examples/wrfout_v2_Lambert.nc Map: Geospatial Information Authority of Japan In preparing this map, with the approval of the Director of the Geospatial Information Authority of Japan, basic map information and electronic topographic maps (tiles) issued by the Geospatial Information Authority of Japan were used. (Approval No. 29, No. 641)
JAXA GCOM-W1 AMSR2
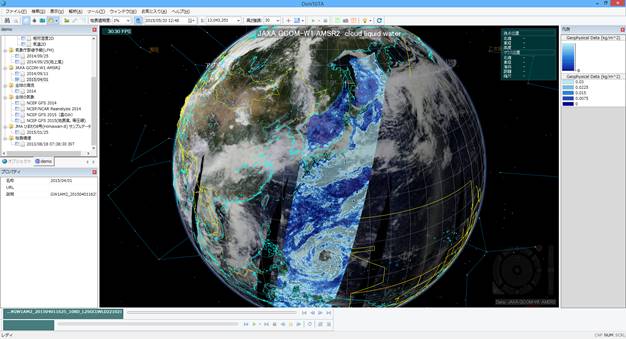
Data used
GCOM-W/AMSR2, Japan Aerospace Exploration Agency GCOM-W1 data provider service, http://gcom-w1.jaxa.jp/
We acknowledge the use of imagery produced by services from the Global Imagery Browse Services (GIBS) operated by the NASA/GSFC/Earth/ Science Data and Information System (ESDIS) with funding provided by NASA/HQ.
Japan Meteorological Agency Himawari-8
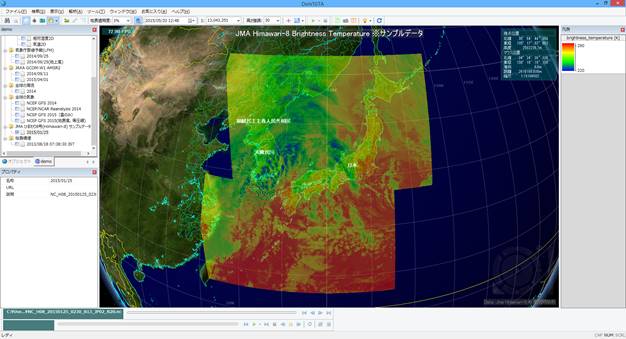
Data used
Weather satellite Himawari-8 sample data : Japan meteorological Agency
Blue Marble: Next Generation courtesy of NASA Earth Observatory. Landsat image courtesy of the Global Land Cover Facility (GLCF).
Using high-resolution digital topography data from NASA's Shuttle Radar Topography Mission (SRTM).
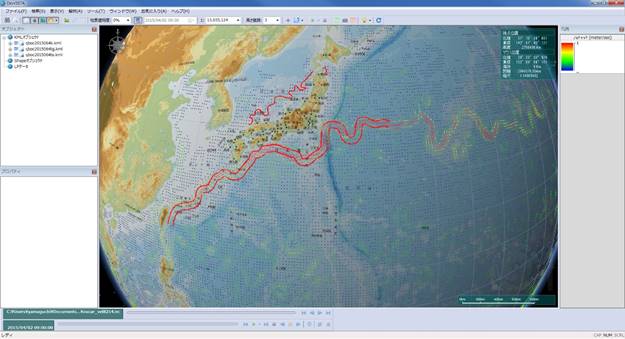
Kuroshio Current Flow Data
Data used
Ocean Surface Current Analysis (OSCAR) data were obtained from JPL Physical Oceanography DAAC and developed by ESR.
Kuroshio position: Japan Coast Guard
Map: Geospatial Information Authority of Japan
In preparing this map, with the approval of the Director of the Geospatial Information Authority of Japan, basic map information and electronic topographic maps (tiles) issued by the Geospatial Information Authority of Japan were used. (Approval No. 29, No. 641)
Vertical slicing function
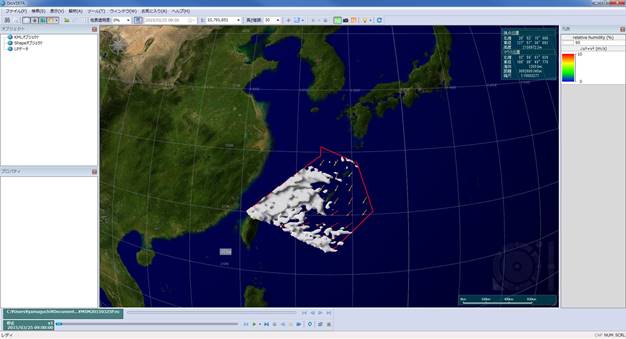
Ability to display only the selected area
Simulation of Kinugawa Embankment Failure (2015)
 Video: Kinugawa River Embankment Failure Simulation (2015)
Typhoon anime
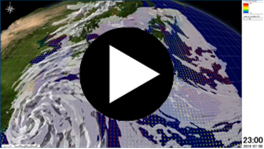 Video: Typhoon anime