Project/ River/ Data
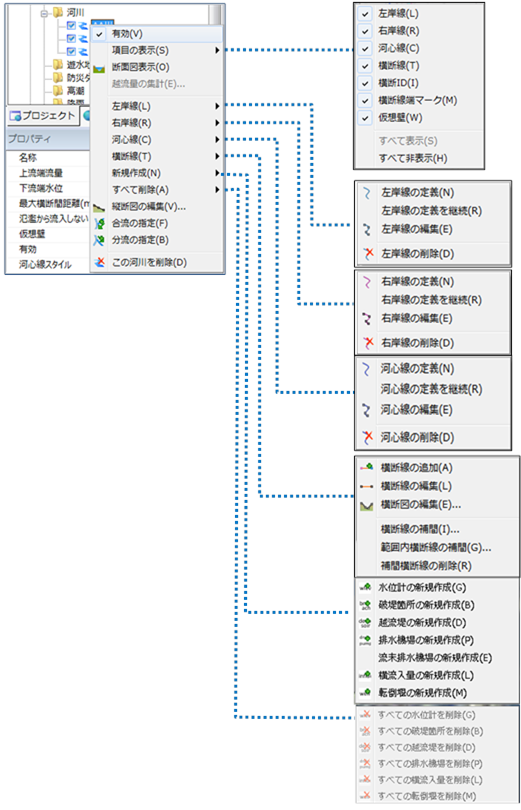 Figure: River data
Table: Context menu items and functions for river data
| Context menu items | function | |
|---|---|---|
| valid | Enable/disable river data. | |
| Displaying Items | - Left Bank Line | Set the items to be displayed on the map. |
| - Right Bank Line | ||
| - Kawashin Line | ||
| - Transverse lines | ||
| - Cross ID | ||
| - Transverse line end mark | ||
| - Virtual Wall | ||
| - See all | ||
| - Hide all | ||
| Cross-sectional view display | Display the river cross-sectional view screen. | |
| Aggregation of overflow flow | Aggregates the overflow flow rate for the specified section. | |
| Left Bank Line | - Definition of the Left Bank Line | Define a new Left Bank Line. |
| - Continue to define the Left Bank Line | Create a left bank line definition from the continuation. | |
| - Edit the Left Bank Line | Edit the vertices of the left bank line you created. | |
| - Deletion of the Left Bank Line | Remove the left bank line. | |
| Right Bank Line | - Definition of the Right Bank Line | Define a new right bank line. |
| - Continue to define the Right Bank Line | Create a right bank line definition from the continuation. | |
| - Edit the Right Bank Line | Edit the vertices of the right bank line you created. | |
| - Removal of the right bank line | Remove the right bank line. | |
| Kawashin Line | - Definition of the Kawashin Line | Define a new Kawashin line. |
| - Continue to define the Kawashin Line | Create a river line definition from the continuation. | |
| - Edit the Kawashin Line | Edit the vertices of the created river line line. | |
| - Deletion of the Kawashin Line | Delete the river core line. | |
| Transverse lines | - Add a cross line | Create a new crosser. |
| - Edit transverse lines | Edit the vertices of the section line you created. | |
| - Edit cross-section | Display the cross-section view editing screen. Set the section information (section shape, edit right left and bank shoulder, edit roughness factor). | |
| - Interpolation of transverse lines | Creates an interpolated section for the entire river at specified distance intervals. | |
| - Interpolation of transverse lines in a range | Creates an interpolated section at specified distance intervals for the extent of the selected section. | |
| - Removal of interpolated transverse lines | Remove all interpolated transverse lines. | |
| Create new | - Create a new water level gauge | Set the water level gauge. |
| - Create new levee locations | Set the breakpoint. | |
| - Create a new overflow levee | Set the overflow embankment of the drainage area. | |
| - Create a new drainage station | Set up the drainage station. | |
| - New drainage station at the end of the stream | Pumps, gates, and weirs are set at the end of the river. | |
| - Create new lateral inflow | Set the lateral inflow amount. | |
| - Create a new tipping weir | Set a tipping weir. | |
| Delete All | Delete all water level gauges | Remove any set water level gauges. |
| - Delete all broken points | Delete all established breaks. | |
| - Delete all overflow levees | Remove any configured overflow levees. | |
| - Removal of all drainage stations | Remove any configured drainage stations. | |
| - Removal of all lateral inflows | Delete all configured lateral inflows. | |
| - Removal of all tipping weirs | Remove any overturning weirs that have been set. | |
| Edit profile drawings | Display the profile editing screen. Check longitudinal information and set information (HQ formula, etc.) for each section. | |
| Specifying a confluence | Set the confluence of tributaries and main rivers. | |
| Specifying a Diversion | Set a diversion from the main river. | |
| Delete this river | Delete a river. |
valid
See Project/ Flowing Flood River/ Data/ Valid.
Displaying Items
When you select a menu, the items appear. Select the items you want to display on the map and check them.
You can select Show all [See all] or Hide all to [Hide All] show or hide all items.
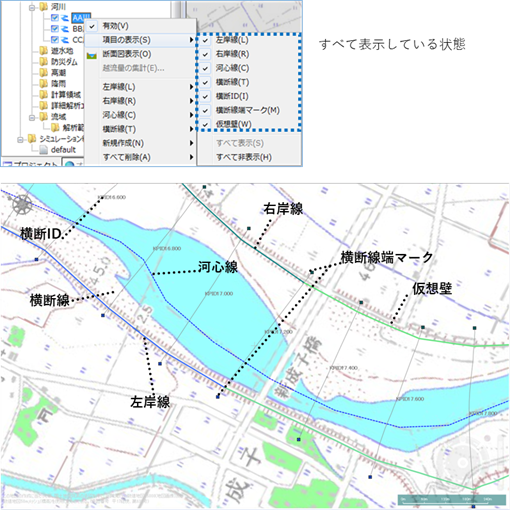
Figure: Displaying items
Cross-sectional view display
Project/ Downstream Flood River/ Data/ Cross-sectional View Refer to Cross-sectional View of Downstream Flood River Data.
Aggregation of overflow flow
Refer to Individual Operation / Trough / Gutter / Overflow Flow Rate Aggregation.
Left Bank Line/Right Bank Line/Kawashin Line
Please refer to Project/ Flowing Flood River/ Data/ Left Bank Line/Right Bank Line/Kawashin Line.
Transverse lines
See Project/ Downstream Flood River/ Data/ Cross Line.
Create new
Create a new water level gauge
-
When you select the menu, the water level gauge dialog appears. Enter the distance from which you want to create the water level gauge.
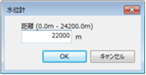
Figure: Displaying the Water Level Gauge dialog. -
[OK] button. A water level gauge is created at the specified location.
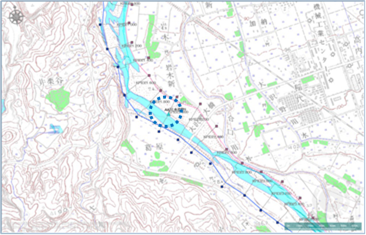
Figure: Creating a water level gauge -
Set the settings related to the water level gauge on the properties screen.
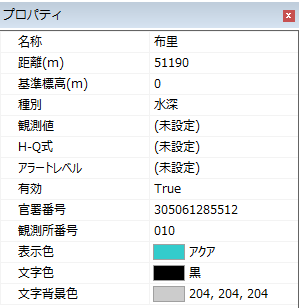
Figure: Water level gauge settings properties screenTable: Property names and settings for water level gauge settings
Property Name What to set name Enter a name of your choice. Distance (m) Sets the cumulative distance at the position where the water level gauge is set.
The initial value is the value specified in the dialog.Base elevation (m) Sets the base elevation. classification Set the information you specify as the depth or level type.
The default value is "water depth".Observations Set to correct the simulation from observations.
On the depth setting screen, set the hour(s) water depth.H-Q formula Calculate the flow rate from the observed values and correct the calculation results.
On the H-Q setting screen, set the relationship between water level and flow rate.Alert Level Specify the water level when emitting as an alert. The following items can be set:
"Planned high water level", "Flood danger water level", "Evacuation judgment water level", "Flood warning water level", "Flood control group standby water level"valid Enable/disable settings.
The initial value is True.
True: Enabled:
False: DisabledGovernment Office Number Any number can be given. This value is referenced in Batching / Extracting River Water Level Data. Observatory number Any number can be given. This value is referenced in Batching / Extracting River Water Level Data. Display color Specify the color of the water level gauge (△) to be displayed on the map.
The default value is Aqua: RGB (51,204,204).
For color settings when each alert level is reached, change the alert level in the legend.Text color Specify the text color of the name of the water level gauge to be displayed on the map.
The default value is black: rgb(0,0,0).Text color background Specify the text color background of the name of the water level gauge to be displayed on the map.
The default value is RGB (204,204,204). -
Water level gauge data
- valid
Enable/Disable. If enabled, a check is displayed.
- Delete this water level gauge
When you select the menu, a confirmation message appears. [Yes] Click the button to delete this water level gauge data.
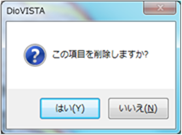
Figure: Delete this water level gauge
Create a new broken levee
-
When you select the menu, the map is in right-left bank line selection mode. Click the designated location on the right and left bank line to specify the location of the break. The × appears at the specified location.
If there are multiple locations, create a new one as separate levee data.
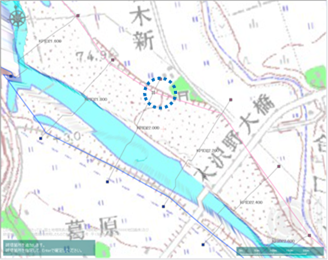
Figure: Specifying a break. -
When the position is confirmed,[Enter] press the key to confirm. Break location data is created under the river data.
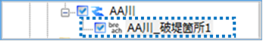
Figure: Create breach location data -
Set the settings related to the break location on the property screen.
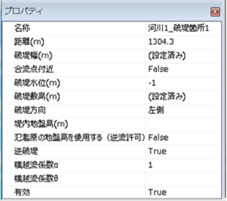
Figure: Properties screen of setting the levees.Table: Broken embankment property names and settings
Property Name What to set name Enter a name of your choice. Distance (m) Set the position of the breach with the cumulative distance.
The initial value is the value specified on the map.Burst width (m) On the Breaking Width Setting screen, set the Breaking Width for Time (s) Change.
The default value is set to be the width of the levee in one hour.Near confluence "(The distance between the breach and the nearest confluence is less than twice the width of the Honkawa River) and ((the width of the tributary flowing into the nearest confluence is more than 0.3 times the width of the main river), or (it is itself a tributary))" (True)
Otherwise: "False"Broken water level (m) Sets the water level at which the levee starts to break.
The initial value is the average value of the riverbed and top height obtained from the cross-sectional shape.Height of the embankment (m) On the Breaking Threshold Height setting screen, set the Breaking Height for Time (s) Change.
The default value is the riverbed.Levee direction Specify the direction of the levee.
The initial value is set to the specified content on the map.Ground height in the embankment (m) Sets the ground height in the levee for the first flood mesh connected from the break. The connection between the fracture site and the flood mesh is confirmed by displaying the simulation shape.
The initial value is not specified.Use the ground height of the floodplain (reverse flow permit) Enable/disable the setting to return to the river from the floodplain mesh.
The default value is False (disabled).
True: Enabled:
False: DisabledReverse Levee If the floodplain water level exceeds the breach water level, the presence or absence of a levee is set.
The default value is "True" (breaking).
True: Break.
False: Do not break.Lateral overflow coefficient α This setting is set when the overflow coefficient (α, θ) is considered in the case of a break. Transverse flow coefficient θ valid Enable/disable settings.
The initial value is True.
True: Enabled:
False: Disabled -
Levee data
-
valid
Enable/Disable. If enabled, a check is displayed.
-
Export the Breakdown Time Series
When you select a menu,[Save As] a dialog appears.
 1
 2
 3
 4
 5
 6
 7
 8
 9
10
11
12
13
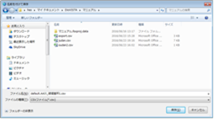 Figure: Export a breakdown time series - Specify any output destination [preservation] Click the button to output the breakdown time series data in CSV format. - The output content is output information on the water level and breach of the river and floodplain at the break. * Exported CSV format (display example in Excel) 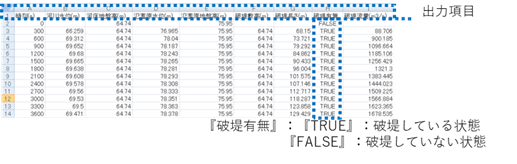 Figure: Exported CSV format (example of display in Excel) - Delete this breach When you select the menu, a confirmation message appears. [Yes] Click the button to delete this breach data. -
Creating a new overflow levee
-
When you select the menu, the map is in right-left bank line selection mode. Click the specified area on the right and left bank line to specify the overflow embankment.
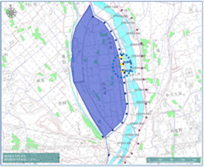
Figure: Specifying an overflow embankment -
When the extent of the overflow levee is confirmed, double-click or [Enter] press the key to confirm. Overflow levee data is created under the river data.
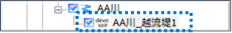
Figure: Create overflow levee data -
Set the settings related to the overflow levee on the property screen.
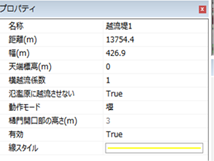
Figure: Properties screen of overflow levee settingsTable: Overflow levee property names and settings
Property Name What to set name Enter a name of your choice. Distance (m) Sets the cumulative distance at which the overflow embankment is to be set.
The initial value is the value specified in the dialog.Width (m) Displays the specified width on the map. Top elevation (m) Sets the top elevation.
The default value is 0m.Transverse flow coefficient Set the transverse flow coefficient.
The default value is 1.Drainage ceiling Specify the drainage ceiling. Do not allow overflow into floodplains After overflowing from the overflow embankment into the detention area, the phenomenon of overflow or collapse from the river into the floodplain is set to be enabled or disabled.
The default value is "True".
"True": Does not overflow or collapse
"False": Overflow / collapse.Mode of operation Select the operation mode "Weir" or "Himon".
Weir: If the external water level
is lower than the internal water level, it moves the flow rate from the inner water to the outside water.
"Himon": When the external water level
is lower than the internal water level, the flow rate is moved from the inner water to the outer water.
The default value is "weir".Height of gutter opening (m) Set the height of the opening to the gutter mode.
The default value is 3m.valid Enable/disable settings.
The initial value is True.
True: Enabled:
False: DisabledLine Style Specify the line style (line type/line width/line color) to be displayed on the map.
The initial values are as follows:
Linetype:
Solid Line Width: 2px Linecolor:
RGB (255,255,0) -
Overflow levee data
-
valid
Enable/Disable. If enabled, a check is displayed.
-
Edit overflow levee data
When you select a menu, the start/end point (blue) and midpoint (red) are displayed.
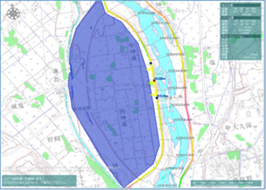 Figure: Editing overflow levee data
Table: Editing and manipulating overflow levee data
Editing operation Edit overflow levee location and width Select the start and end points and move them with mouse drag. Shift the position of the overflow embankment without changing the width Select the midpoint and move it with mouse drag. -
Double-click or [Enter] press to confirm your edits.
-
Delete this overflow levee
When you select the menu, a confirmation message appears. [Yes] Click the button to delete this overflow levee data.
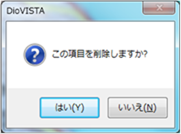 Figure: Removing an overflow levee
-
Creating a new drainage station
-
Specify the drainage target area on the map with a mouse click.
If there are multiple drainage areas, set the boundaries to overlap about half the target mesh size.
[Ctrl] When you press the key, you can specify the range with a rectangle.
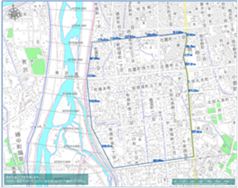
Figure: Designation of drainage target area. -
Double-click or [Enter] key to confirm.
-
Specify the location of the drainage pump by clicking in the drainage area.
[Enter] Confirm with the key.
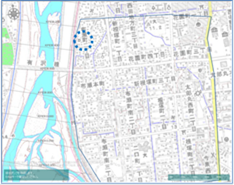
Figure: Specifying the location of the sump pump. -
To find the location of the drainage river, click on the right-left bank line.
[Enter] Confirm with the key.
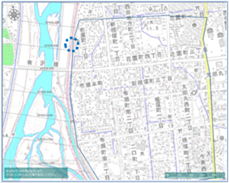
Figure: Determining the location of the river to be drained -
Set the settings related to the drainage station on the properties screen.
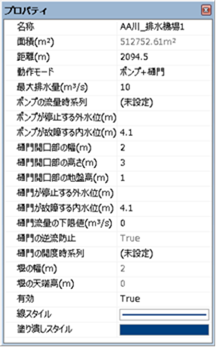
Figure: Drainage station setting properties screen tableTable: Drainage station property names and settings
Property Name What to set name Enter a name of your choice. Area (m^2)(*1) Displays the area of the specified extent on the map. Distance (m) (*1) Set the cumulative distance of the drainage destination river.
The initial value is set to the cumulative distance of the river specified on the map.Mode of operation Select the operation mode "Pump", "Himon", "Pump + Gate", and "Weir".
Pump: Moves water from the inland to the outside water at the specified amount of wastewater.
"Himon": When the external water level is lower than the internal water level, the flow rate is moved from the inner water to the outer water.
"Pump + Himon": It operates as a pump when the outside water level is higher than the internal water level, and as a gutter gate when it is low.
Weir: If the external water level is lower than the internal water level, it moves the flow rate from the inner water to the outside water.
The default value is "pump".Operation mode (*2) Enabled when the operation mode = "Pump + Himon", and select "Difference between external water level and inland water level", "Outer water level", and "Outside water level + natural flow".
"Difference between external and inland water levels": This operation conforms to the "Ministry of Land, Infrastructure, Transport and Tourism Flood Inundation Area Map Creation Manual (4th Edition) July 27". The operation mode is determined by the relationship between the water level of the external water level and the internal water level.
Outside Water Level: Determines the operating mode based on the external water level alone.
"Outside water level + natural flow": The operation mode is determined only by the external water level. However, if the gutter gate is closed and the external water level \< inland water level is reached, the pump stops and the gutter gate opens.
The default value is "difference between external water level and inland water level".Maximum displacement (m^3/s) Set the maximum water discharge to Pump, Pump + Gate mode.
The default value is 10m^3/s.Pump flow time series Sets the flow rate to be drained by the pump in chronological order. Water level at which the pump stops (m) When pump, pump + gutter mode is selected, the stop water level is set. Water level at which the pump fails (m) When the pump, pump + gutter mode is selected, the fault water level is set. Width of gutter opening (m) Set the width of the opening to Himon and Pump + Gate mode.
The default value is 2m.Height of gutter opening (m) Set the height of the opening to Himon and Pump + Gutter mode.
The default value is 3m.Ground height at the gutter opening (m) Set the ground height of the opening to Himon and Pump + Gutter mode.
The initial value is the ground height at the specified location.Outside water level where the gutter gate stops (m) Set the stop water level to Pump + Gate mode. Outside water level when the gutter gate is closed (*2) In pump + gutter mode, when the operation mode is "external water level" and "external water level + natural flow", set the outside water level to close the gutter gate.
The initial value is not set.Outside water level to open the gutter gate (*2) In pump + gutter mode, when the operation mode is "external water level" and "external water level + natural flow", set the outside water level to open the gutter gate.
The initial value is not set.Inland water level where the gutter gate breaks down (m) Set the fault water level to Himon and Pump + Gate mode. Lower limit of gutter flow rate (m^3/s) Set the lower limit flow rate to flow from the gutter gate. Prevention of backflow of gutter gates Sets whether or not the main river can flow back to the tributaries.
The default value is "True" (does not regurgitate).
True: No regurgitation.
False: Regurgitation.Himon opening time series Set the opening and closing of the gutter gate according to the time.
0: Closed
state "1": Open stateWeir width (m) Set the weir width to Weir mode.
The default value is 2m.Weir top height (m) In Weir mode, set the top height of the weir.
The default value is 0m.valid Enable/disable settings.
The initial value is True.
True: Enabled:
False: DisabledLine Style Specify the line style (line type/line width/line color) to be displayed on the map.
The initial values are as follows:
Linetype:
Solid Lineweight: 2px Linecolor:
RGB(0,64,128)Fill style Specifies the style in which the drainage area is filled on the map.
The initial values are as follows:
Fill: Fill Color: RGB (0,64,128) Line
Color: RGB (0,64,128)*1 It is only available in the properties of the drainage station. It is not in the properties of the drainage station at the end of the stream.
*2 It is only available in the properties of the drainage station at the end of the stream. It is not in the properties of the drainage station.
-
Drainage station data
-
valid
Enable/Disable. If enabled, a check is displayed.
-
Edit drainage area
-
When you select a menu, vertices are displayed.
変更する位置をクリックしてください。
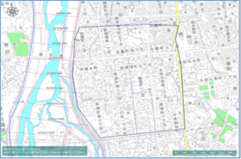
図: 排水対象エリアの表示表: 排水対象エリアの編集内容と操作
編集内容 操作 移動 頂点を選択し、マウスドラッグで移動します。 追加 線上をクリックすると、頂点が追加されます。 削除 [Ctrl] キーを押しながら頂点をクリックすると、頂点が削除されます。 -
To revert to the previous state, [Revert] select Edit menu .
To cancel editing,[Esc] press the key.
-
[Enter] Press the key to confirm your edits.
-
-
Change the position of the sump pump
-
When you select a menu, you can specify the drainage target area.
変更する位置をクリックしてください。
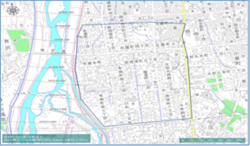
図: 排水ポンプの位置を指定 -
[Enter] Press the key to confirm your edits.
-
-
Change the position of the drainage destination river
-
By selecting the menu, you can change the position of the river to which the water is drained. Click on the Right Left Bank line.
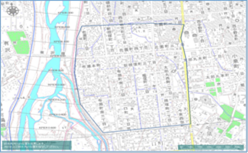
図: 排水先河川の位置を変更 -
[Enter] Press the key to confirm your edits.
-
-
Export Flow Rate
-
When you select a menu,[Save As] a dialog appears.
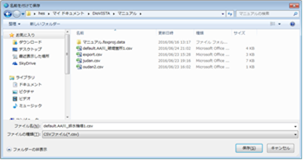
図: 流量をエクスポート -
Specify any output destination [preservation] Click the button to output the flow time series data in CSV format.
-
The output content is output in chronological order with pump position, water depth and water level of drain destination river, pump status and flow information.
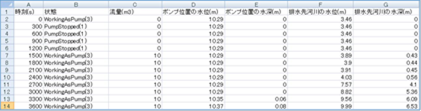 Figure: Exported CSV format (example of display in Excel)
-
-
Delete this drainage station
When you select the menu, a confirmation message appears.
[Yes] Click the button to delete this drainage station data.
-
New drainage station at the end of the stream
-
When you select the menu, the end-of-stream drainage device data is displayed under the specified river.
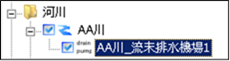
Figure: Selecting the inflow position -
Set the settings related to the drainage station at the end of the flow on the property screen.
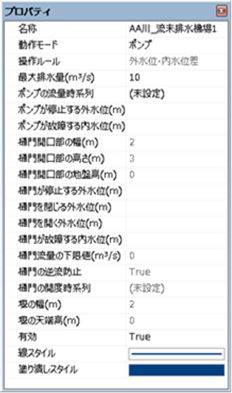
Figure: Drainage station properties screen at the end of the flowTo set the settings, create new / create a new drainage station / set the settings related to the drainage station on the property screen. Please refer to .
Creating a new lateral inflow
-
When you select the menu, the map is in right-left bank line selection mode.
Click where you want to inflow.
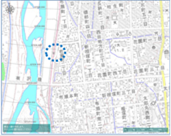
Figure: Selecting the inflow position -
When the position is confirmed,[Enter] press the key to confirm.
Lateral inflow data is created under the river data.
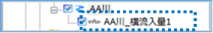
Figure: Creating lateral inflow data -
Set the settings related to lateral inflow amount on the properties screen.
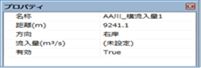
Figure: Property screen of lateral inflow settingTable: Lateral inflow property names and settings
Property Name What to set name Enter a name of your choice. Distance (m) Sets the cumulative distance of the rivers to be inflowed.
The initial value is set to the cumulative distance of the river specified on the map.direction Specifies the direction in which the inflow should occur.
The initial value is set from the right-left bank line specified on the map.Inflow (m^3/s) Set the flow rate for time(s) change on the lateral inflow setting screen.
The initial value is not set.valid Enable/disable settings.
The initial value is True.
True: Enabled:
False: Disabled -
Lateral inflow data
-
valid
Enable/Disable. If enabled, a check is displayed.
-
Delete this lateral inflow
When you select the menu, a confirmation message appears.
[Yes] Click the button to delete this lateral inflow data.
 Figure: Remove this lateral inflow
-
Creating a new tipping weir
-
When you select the menu, the map is in right-left bank line selection mode. Click the location of the tipping weir.
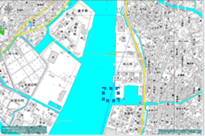
Figure: Choosing the location of a tipping weir -
When the position is confirmed [Enter] , press the key to confirm.
Fall weir data is created under the river data.
Figure: Create tipping weir data -
Set the settings related to the tipping weir on the property screen.
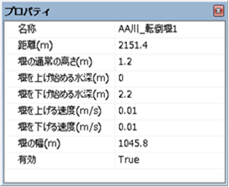
Figure: Properties screen of tipping weir settingsTable: Inverted weir property names and settings
Property Name What to set name Enter a name of your choice. Distance (m) Sets the cumulative distance of the river where the tipping weir is placed.
The initial value is set to the cumulative distance of the river specified on the map.Normal height of the weir (m) Set the normal height of the weir.
The default value is set to half the top height of the cross-section.Water depth to start raising the weir (m) Set the depth of the water at which the weir begins to rise.
The default value is 0 m.Water depth at which the weir begins to be lowered (m) Set the depth of the water at which the weir begins to be lowered.
The default value is set to half the top height of the cross section + 1 m.Weir lifting speed (m/s) Sets the speed at which the weir is raised.
The default value is 0.01 m/s.Speed of lowering the weir (m/s) Set the speed at which the weir is lowered.
The default value is 0.01 m/s.Weir width (m) Set the width of the weir.
The default value is set the river width of the cross-section.valid Enable/disable settings.
The initial value is "True" (enabled).
True: Enabled:
False: Disabled -
Tumble data
-
valid
Enable/Disable. If enabled, a check is displayed.
-
Remove this tipping weir
When you select the menu, a confirmation message appears.
[Yes] Click the button to delete this tipping weir data.
 Figure: Delete this tipping weir.
-
Delete All
The menu becomes active when there is a water level gauge, a broken embankment, an overflow embankment, a drainage station, a lateral inflow, or a tipping weir. When you select the menu, a confirmation message appears. [Yes] Click the button to delete all data.
 Figure: Delete all
Edit profile drawings
See Project/ Flowing Flood River/ Data/ Profile Drawing.
Specifying a confluence
Refer to Project/ Downstream Flood River/ Data/ Specifying Confluence of Downstream Flood River Data.
Specifying a Diversion
Refer to Project/ Downstream Flood River/ Data/ Specifying Diversion Downstream Flood River Data.
Delete this river
When you select the menu, a confirmation message appears. [Yes] Click the button to delete the river data.